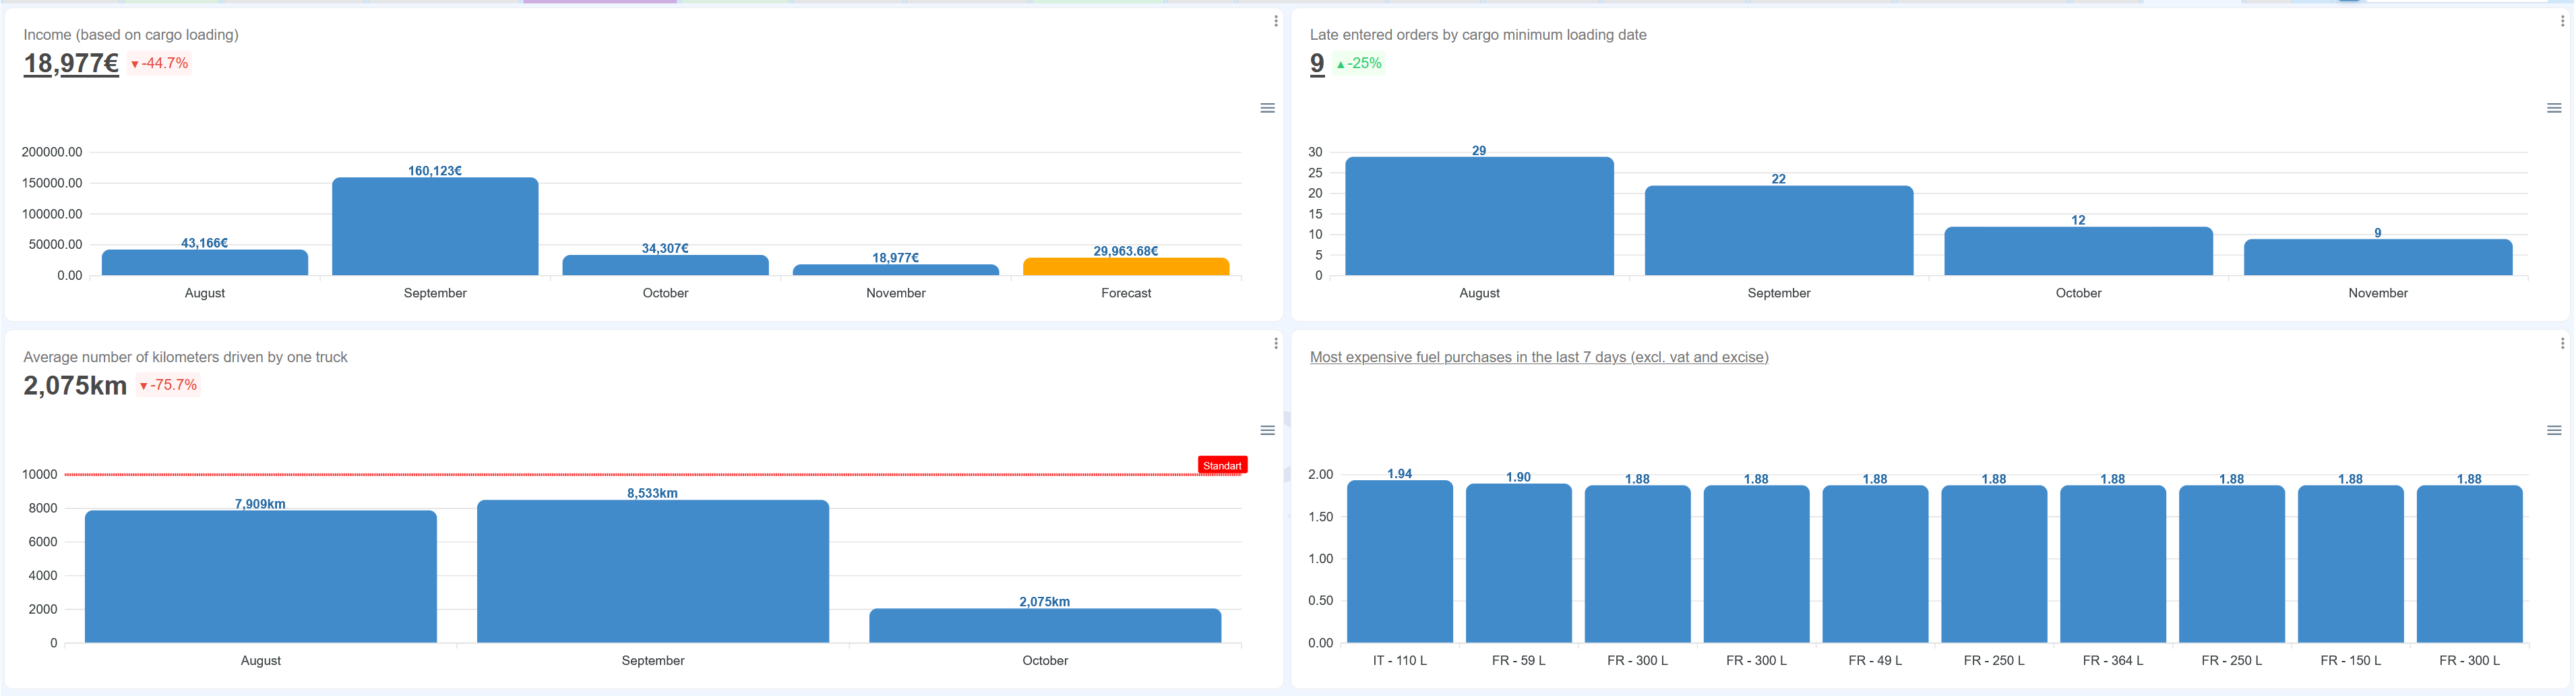
Managers and accounting staff who track company performance indicators: revenue, profit, receivables, fuel costs, and the work of drivers and trucks.
What problem it solves
Metrics had to be gathered from several reports and assembled into tables by hand, and each company built its own dashboards from scratch. The resulting figures were hard to verify, since it was unclear which orders or invoices they were made up of and why they had changed.
What is new
There are currently 17 themed tabs with ready-made charts, ranging from finance and orders to transport, drivers and alerts, plus separate overviews for directors. Every bar in a chart is a link to the report the data comes from, showing the specific orders, invoices or trips behind that figure. Most charts show the change compared with the previous period, and for some metrics you can set your own target and see straight away whether it has been met.
Benefits
For managers: open the start page and immediately see how the business is doing, what has changed and where action is needed. For accounting and management staff: no more collecting and checking figures by hand every month, since every metric can be traced back to specific records. For the company: numbers you can trust, and problems spotted earlier, such as overdue invoices, missing CMRs and expiring documents.
A client's order - a PDF, a photo or the email text itself - InfoTrans reads it and fills in the order form; all you do is check and confirm. Emails from the orders mailbox are collected automatically.
No more transferring invoices to another program or entering them on the KSeF website. You see what is missing before sending, and the KSeF number and UPO are saved with the invoice.
Transport managers see a truck's daily kilometres from tracking alongside its tachograph driving, work and rest times in one row. No more comparing two reports side by side in Excel.
Less admin. More transport.
3 months free · live support included · no long-term contracts